Models
Reading time:
2
min

Why did Opus 4.6’s token usage in Claude Code skyrocket in the period February 25 to March 4, 2026? We stumbled upon this trend in the course of our analysis of the SWE-chat corpus, and we can’t get it out of our heads. We’re now obsessed with solving the mystery for its own sake… but of course these token-usage trends also have a significant impact on everyone’s Anthropic bills!
The Mystery
The following figure summarizes what we know so far. We are tracking various token-usage and token-usage-adjacent quantities over time (x-axis), and the y-axis measures the changes in each of these quantities relative to its respective early February baseline.
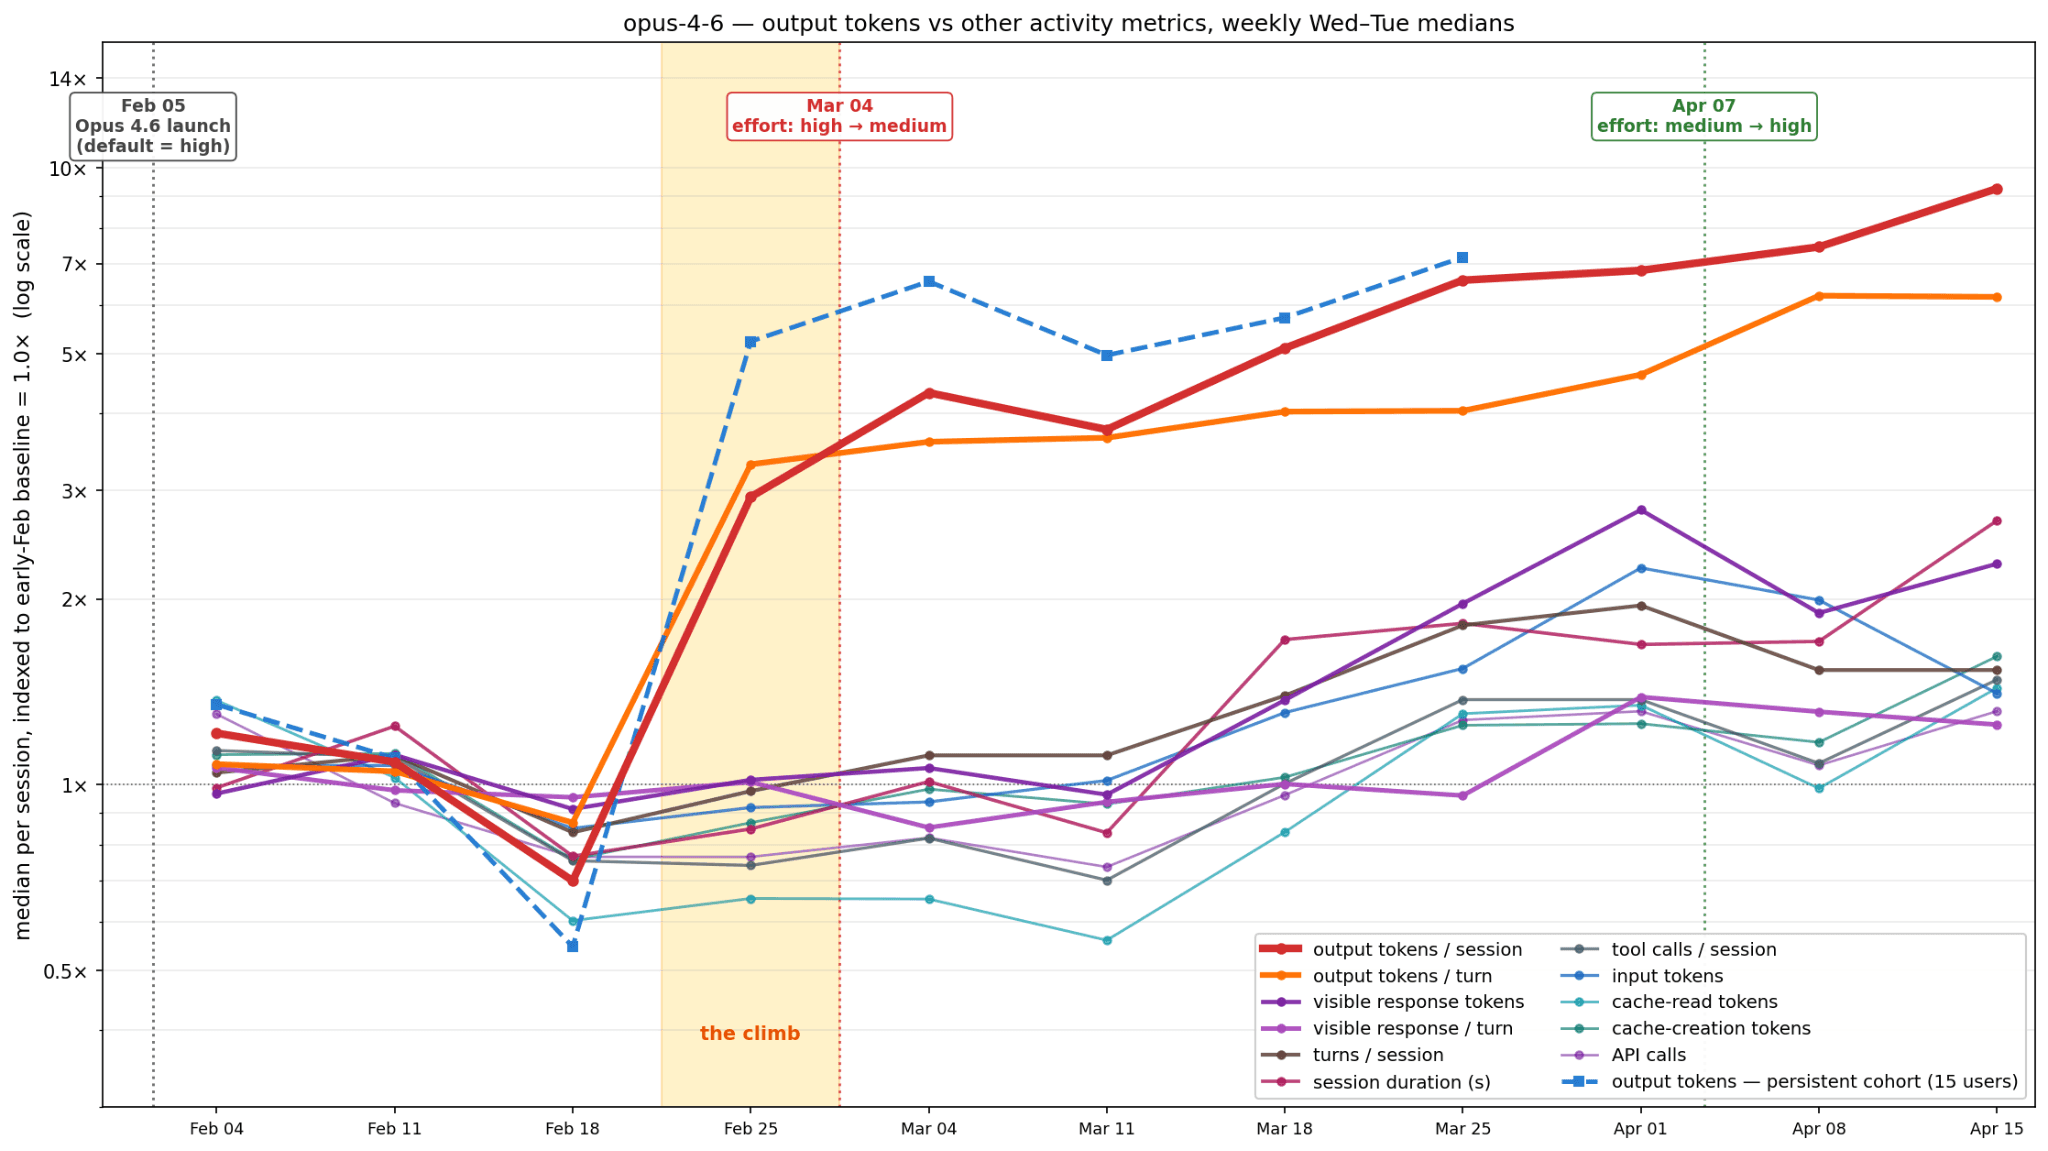
Starting around February 25, Opus 4.6 token usage (the red line in our plot) skyrocketed. This is the highlighted area of the plot: the climb. We are not aware of any change to the model that might have caused the climb. That is the essence of our mystery.
Adaptive thinking does not solve the mystery
Opus 4.6 launched on February 5, 2026. The big change from Opus 4.5 was the introduction of adaptive thinking, which “lets Claude dynamically determine when and how much to use extended thinking based on the complexity of each request”. Anthropic launched the model with default thinking “high”. People immediately noticed that Opus 4.6 used way more tokens than Opus 4.5. This is even before the skyrocket.
On March 4, Anthropic changed the default reasoning to “medium”. In an April 23 postmortem, they said this was a response to the latency that “high” introduced. As you can see, this might have slowed the rise in tokens somewhat, but it did not reverse it. On April 7, they changed the default back to “high”. This change did not cause a sudden spike in token usage comparable to the February 25 spike. In other words, the known changes to the default thinking effort seem to have had a smaller effect than whatever happened on or around February 25.
The bugs shipped and reverted around this time (introduced Mar 26 and Apr 16, reverted Apr 10 and Apr 20; see their postmortem for details) happened later and seem not to change things very much, so we set them aside as potential factors.
Ruling out other explanations
Our plot tracks a number of other quantities that might be relevant to this sharp increase, but none of them unravels our mystery.
For example, as models improve, session length is likely to increase. (We thank Will Held for raising this issue with us.) The brown line in our plot tracks session length at the level of turns, and the pink line tracks session length in seconds. Both show a modest increase overall. In contrast, the orange line tracks output tokens per turn, that is, it controls for session length. This rises just as steeply as the per-session rate during the mystery period. Thus, increased session length does not solve the mystery; the per turn rate also soared.
Is Opus 4.6 just chattier? The dark and light purple lines track visible response tokens, with and without normalization by turn. These show that Opus 4.6 did become somewhat chattier, but the timing of this increase doesn’t align with the climb. During the mystery week itself, visible response tokens per turn is essentially flat (≈60 tokens / turn before and ≈63 during).
We’ve included a few other measures of session activity: tool calls, API calls, cache usage. All of these do increase over time, but in a narrow band around 1–3x the baseline. Only the number of output tokens jumped up from its baseline starting February 25.
One might wonder whether the mystery is explained by a change in the user base for SWE-chat. In principle, a group of new users might have arrived on February 25 and caused a fundamental shift in the usage patterns. To address this, we defined a cohort of 15 users who had sessions throughout the key period. This cohort’s pattern tracks the larger dataset pattern almost exactly (dashed blue line), so this seems like a dead-end. (We also looked within individual days: every percentile of the per-session token distribution moves up together through the climb, which rules out a gradual server-side rollout where some sessions got the new behavior before others.)
The SWE-chat data do not allow us to precisely count the number of tokens that come from thinking. However, all the specific measures of token usage we have remain in that 1–3x band relative to their baselines, which strongly suggests that the mystery increase is caused by either tool-orchestration overhead or Opus’s private lucubrations.
Why this matters
Our ultimate goal is to assess the extent to which all these tokens are making us more successful as engineers. The above situation seems ideal for addressing this, because we can track outcome success measures over this same period and see whether they correlate with token usage. From there, given the richness of SWE-chat, we might even be able to make progress in identifying the causal links between these quantities. However, it makes us really nervous that we don’t know what caused the biggest change in token usage here.
Help us solve the mystery
If you would like to join our detective team, please reach out to our tip-line: hello@bigspin.ai. We welcome hunches, hypotheses, and insights. We also have a lightweight script you could run to gather your own token-usage data, and then you could share the resulting spreadsheet with us to expand our collective evidence base.


