Models
Reading time:
5
min

Coding assistants like Claude and Codex generate more tokens than ever before, and the cost of these tokens is generally rising. We all sense these trends as we watch the token counts climb in the apps, and we feel them viscerally when we review our monthly bills.
Are all these tokens actually leading to better results for us? This question is increasingly on the minds of individual users and large organizations, because the frontier LLM providers have started to confront us with the true cost of all our usage. The sticker shock can be significant; the days of token-maxxing may be numbered.
What is the purchasing power of a token? Does a token buy you more or less now than it did a few months ago? To address these questions, we build a consumer price index (CPI) for AI coding output from Anthropic’s Opus 4.6 model. Unlike the usual sort of CPI, ours contains engineering events rather than milk and rent, but the logic is the same. Our sample comes from SWE-chat, specifically, 5,851 real Opus 4.6 sessions from February 5 to April 15, 2026.
The short answer to our question is sobering:
The purchasing power of an Opus 4.6 token fell dramatically from February 5 to April 15, 2026. The downward trend holds for all the goods in our engineering basket.
This looks like tokenflation: your Opus 4.6 token budget is not going to take you as far as it did even just a few months ago. We do not know the full causal story behind this trend, though we strongly suspect that changes in the job mix of tokens (away from pure code generation and toward thinking and explanation) are a significant factor (see below for details).
Important note: our analysis covers only Anthropic’s Opus 4.6 model for the period February 5 to April 15, 2026. We do not have sufficient data from other models, providers, or time periods to broaden the empirical picture right now. We hope this post serves as a call to action for people to begin tracking these trends industry-wide, since they are critical to the economics of AI.
Breakdown by goods
Our basket of deliverables includes some standard engineering outcomes: lines of code and documentation, both drafted and committed; files touched; and PRs shipped. However, we feel strongly that these outcomes alone fail to capture the true value of our coding agent sessions, which range from quick check-ins to extended collaborations that are more about exploration and discovery than shipping code. (If you are interested in better understanding your own Claude Code sessions, check out our free, anonymous plugin.)
To help acknowledge these intangibles, we defined a novel knowledge capture good: an instance where work is stored somewhere durable (a CLAUDE.md, an AGENTS.md, a plan doc, a skill definition, or a project rule). This is still a purely mechanical signal, but it helps us track how knowledge accumulates in coding agent sessions.
The following figure provides a detailed look at our CPI. The x-axis tracks time, and the y-axis tracks output units per token, normalized to Phase A. All of the deliverables trend downward. The black line is the average of all goods, which indicates that a token in mid-April bought about $0.23 on the February $1.00.
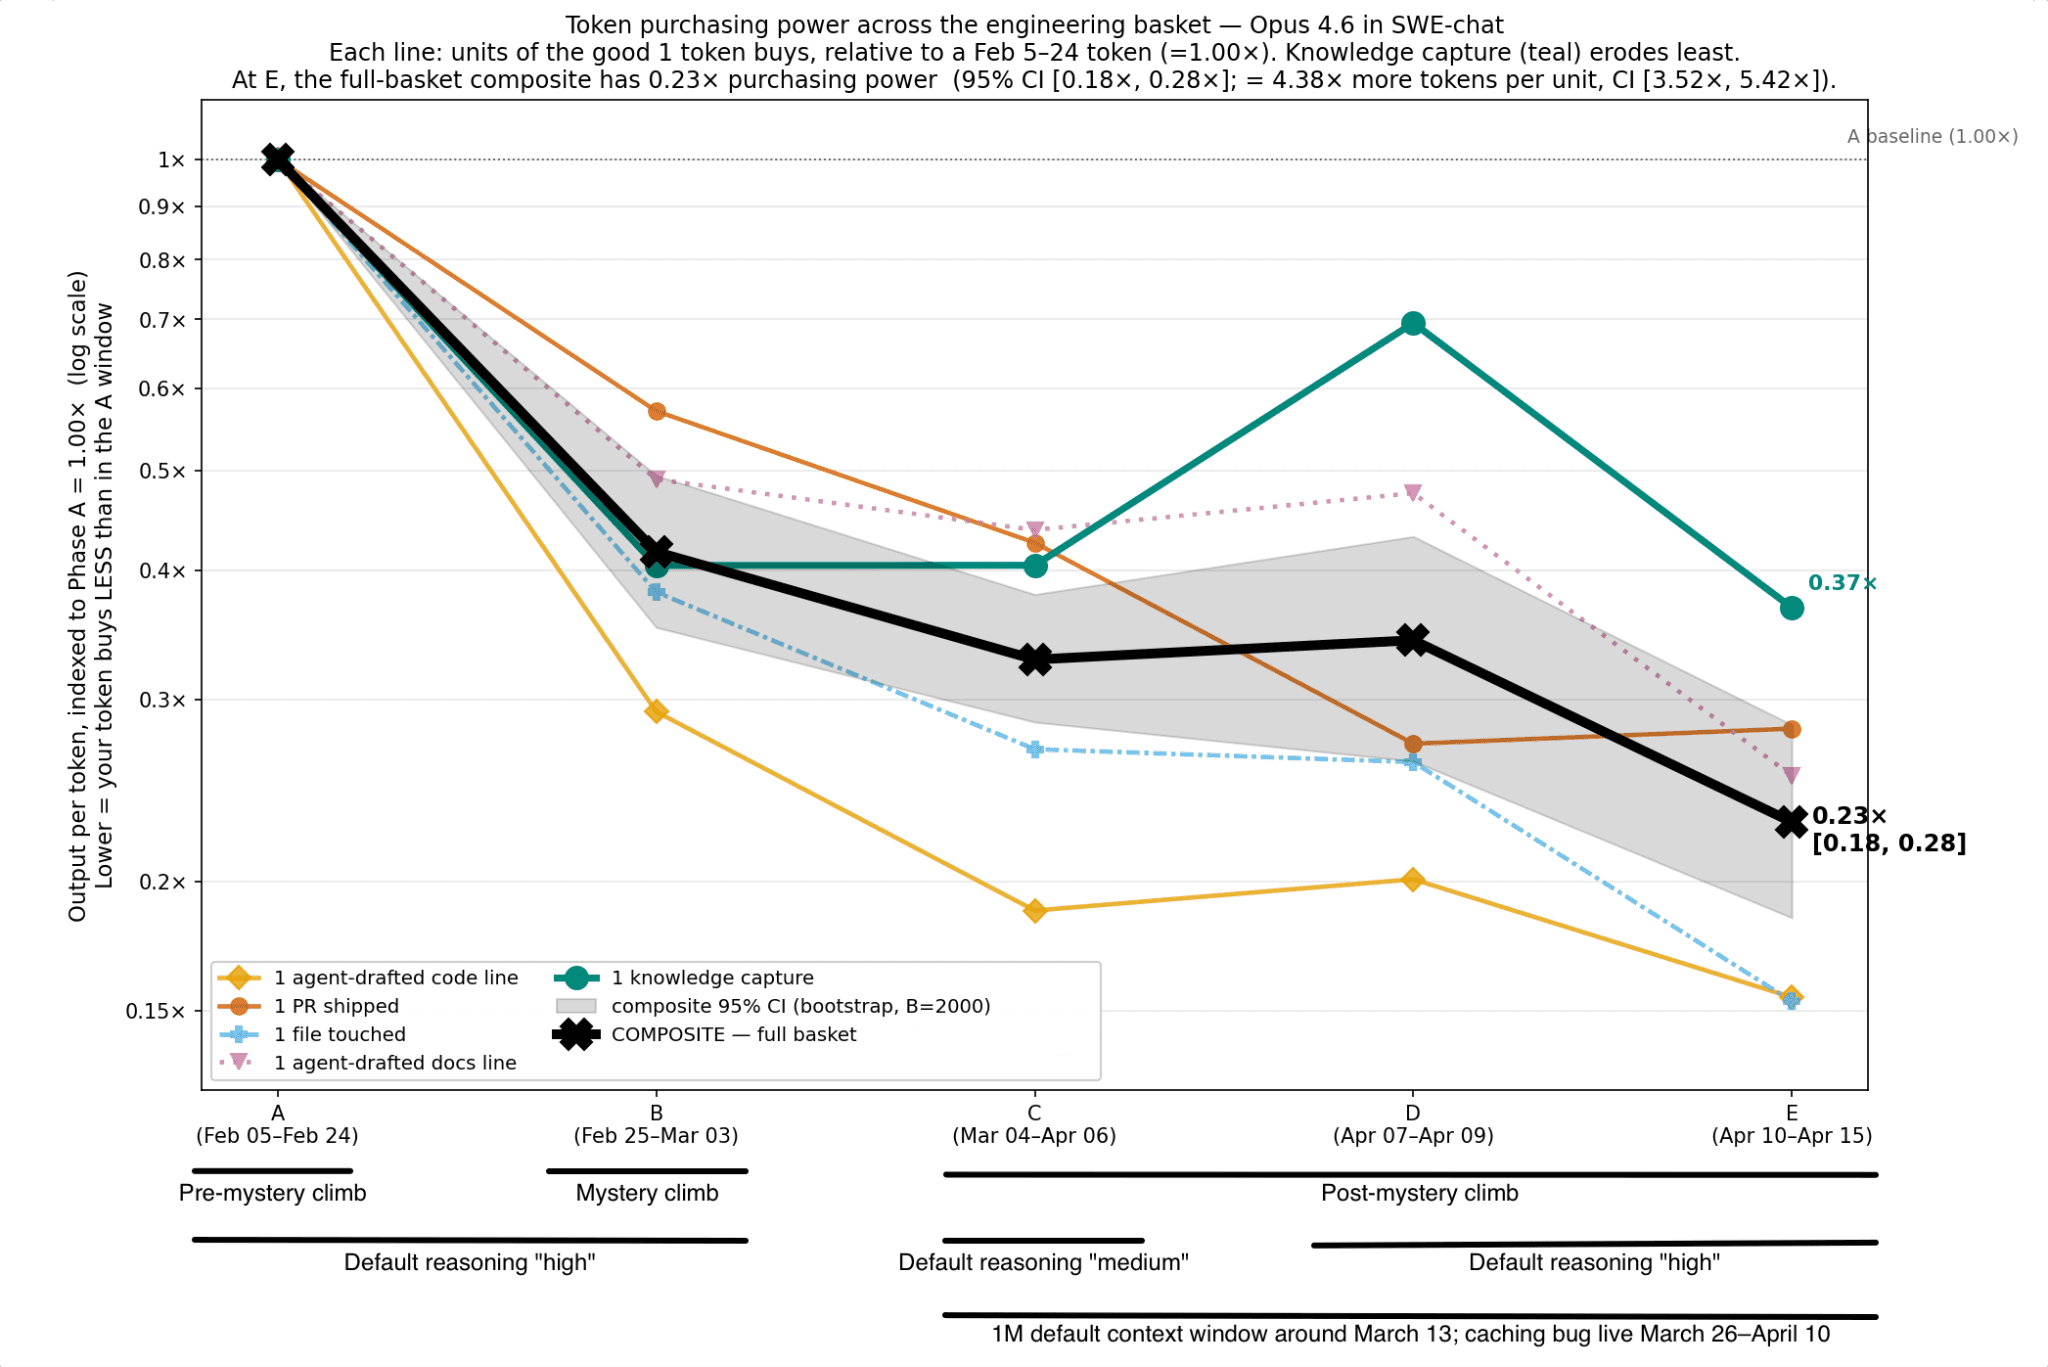
We have followed standard CPI practices for this analysis: our basket of engineering goods has five items in it (PRs, files touched, etc.). In each phase P, the price of one of these goods G is the total output tokens in P divided by the total units of G produced in P. To convert these prices to dollars, we used Opus 4.6’s current list price ($75 per million output tokens), applied to all periods to isolate token-quantity inflation from any pricing changes Anthropic may have made. We also implemented a hedonic adjustment by tracking code survival, i.e., the fraction of lines committed during each phase that still exist in the repository 4 days later. We find that the code survival rate is about 90% in Phase A and 95% in Phase E, so we incorporate a uniform 5% hedonic adjustment. This has the effect of softening the tokenflation trends.
The time periods for our analysis were chosen deliberately (see the timeline annotations at the bottom of the figure). The choices mainly reflect our attempt to navigate the exogenous events that Anthropic described in their April postmortem. In addition, we previously documented a mysterious rise in token usage for Opus 4.6 in the period February 25 to March 4, 2026. As of this writing, we have not unraveled that mystery, and so we have carved out that time period. Even if we take the highly conservative step of setting our baseline to after this mysterious increase, we still see downward trends for all our engineering goods.
What 10K tokens buys you
Another way to make the above trends vivid is to ask what 10K tokens bought you in mid-April as compared to early February. The following table summarizes, based on sessions within ±20% of 10K output tokens:
February (Phase A) | mid-April (Phase E) | |
|---|---|---|
PRs | 0.30 | 0.16 |
agent-drafted code lines | 630 | 91 |
files touched | 8.2 | 3.6 |
knowledge captures | 0.95 | 0.42 |
The average 10K-token session in early February achieved about a third of a PR, drafted 630 lines of code, touched 8 files, and had about 1 knowledge capture. The same session in mid-April achieved about a sixth of a PR, drafted 91 lines, touched about 4 files, and had less than a half a knowledge capture. We should add that Opus 4.6 still completes discrete units of work at roughly the same per-session rate. It’s just that it requires many more tokens to do so.
The job mix of tokens has changed considerably
We suspect that an important factor in the tokenflation we are seeing is that Opus 4.6’s output tokens were doing very different things in February as compared to mid-April.
Because of how the Claude API logs assistant messages, we are able to track these changes fairly precisely. Each message in a session transcript is either pure thinking (the model deliberating, billed but not surfaced to the user), pure text (the model talking to the user), or pure tool use (the model writing code through Edit/Write/MultiEdit calls). Messages with mixed block types are only 0.1% of the corpus and so can be safely ignored.
The nature of what changed is clear in the following figure, which tracks share of billed output tokens (y-axis) over our time periods (x-axis):
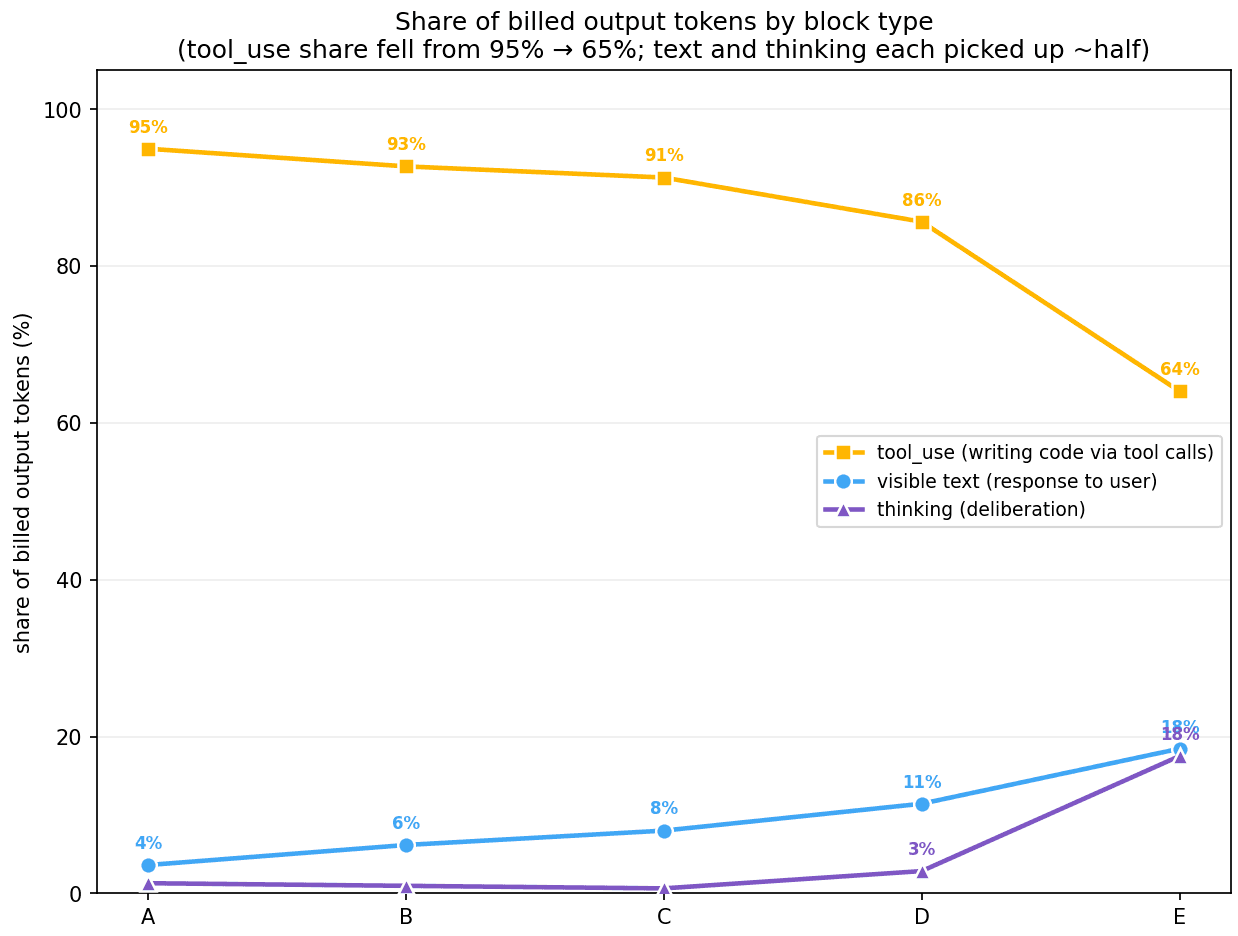
In February, almost every output token went to Opus 4.6 writing code through tool calls. By mid-April, the tool-use share had fallen dramatically, with visible text and thinking each picking up about half of the difference.
This partly challenges the popular framing that Claude is “thinking more”. This is true: thinking rose from 1% to 18% in our time period. However, it’s more accurate to say that the token’s job mix changed in all categories. A February token was almost entirely funding code generation. A mid-April token was funding code generation, plus a larger amount of model-to-user explanation, plus a larger amount of explicit deliberation.
Potential causes of this observed tokenflation
Our CPI sounds an alarm about tokenflation. A few potential (and not mutually exclusive) explanations for this trend come to mind:
The changing job of tokens. As we discussed above, tokens are increasingly devoted to thinking and explanation, rather than just code generation. This is likely a proximate cause of tokenflation. Our findings suggest that this did not pay off in terms of our chosen outcomes, but it could be that we need a more diverse basket of goods to see the value added.
Calibration. It could be that Anthropic is still figuring out how to calibrate model behaviors to deliver the most value per token. Our data come from a period in which coding agents improved by leaps and bounds, and such progress is likely to involve some stumbles. In addition, Anthropic’s own postmortem shows that they are actively shaping the product.
Harder tasks. It could also be that users are tackling harder tasks, which we would expect to increase token usage and decrease production of at least some of the engineering goods we are tracking. This actually aligns with our own experiences using coding agents: we are asking them to help with increasingly challenging long-running tasks, and this often involves deep, open-ended collaboration with them that does not always lead directly to easily measured engineering goods being produced.
We don't think any of these three is the full answer. The changing job of tokens is the most concrete evidence we have; the other two seem real but are harder to quantify.
Practical consequences
Are you tasked with forecasting AI coding spend for your organization? If so, more power to you! Our CPI suggests that producing engineering goods with AI has gotten considerably more expensive over the last few months. Forecasts that hold tokens-per-output constant are likely to underestimate spending going forward. And, of course, the macrotrends in the industry also suggest that large price increases are coming soon as the frontier providers chase profitability in a serious way for the first time.
The impact of the above trends might vary depending on the nature of the work being done in your organization. For example, if your team’s primary output metric is PRs shipped, the cost increase is fairly moderate. If your workflow involves a lot of agent-drafted code that gets reviewed and revised, the increase is more severe. The more general lesson is to consider what outcomes matter most to you and begin tracking the costs of those outputs closely.
At Bigspin, we have developed a tool called token-roi for tracking token usage relative to a variety of outcomes in Claude Code. You can run this on its own or as part of the Bigspin plugin for Claude Code. The tool simply inspects your locally stored Claude Code sessions, and it shares no data with us. Running this tool should give you a better sense for your return on investment in tokens. We would love to hear from you about the trends you see in your data, and we are especially interested in ideas for other outcome measures that our tool could usefully track: hello@bigspin.ai.


